HubSpot Reporting is not just a tool; it is a transformative system that empowers businesses to make informed decisions, drive performance improvements, and stay ahead of the curve. So, buckle up and get ready to revolutionise the way your business operates in a data-driven world.
Exploring the basics of HubSpot reporting
HubSpot, as a leading CRM, marketing, sales, and customer service platform, offers robust reporting features designed to provide insights into your business's performance. However, navigating HubSpot's reporting capabilities can be daunting for beginners. This comprehensive guide aims to demystify the process, helping you to get started with HubSpot reporting effectively.
Diving into the basics of HubSpot reporting unveils a world of endless possibilities for businesses seeking to harness the power of data. HubSpot reporting is more than just a tool for data collection and analysis; it is a sophisticated system that transforms raw data points from various HubSpot modules into actionable insights. This process involves the extraction of crucial metrics and the interpretation of data trends, forming the cornerstone for unlocking the full potential of HubSpot reporting.
To help you get started, check out our ebook "How to Leverage HubSpot Reporting to Maximise Business Growth", which is designed to unlock the full potential of HubSpot’s analytics and transform your data into your most powerful asset. Click below to get your free copy:
Key Components of HubSpot Reporting:
- Reports: Visual representations of your data, which can be customised and filtered to meet your needs.
- Dashboards: Collections of reports that provide an overview of specific aspects of your business, such as sales performance or marketing activities.
- Analytics Tools: Specialised tools for deeper insights into specific areas, like website traffic or email marketing effectiveness.
Now let's take a closer look into each of them.
HubSpot Reports
Reports in HubSpot are the backbone of your data analysis process. You can find a huge range of ready-made reports in HubSpot's library or build one yourself. These reports transform raw data into visual representations, such as graphs, charts, and tables, making it easier to interpret complex information at a glance.
One of the strengths of HubSpot reports is their high degree of customisation. Users can create reports based on a wide array of data points, from basic contact information to detailed performance metrics across marketing, sales, and service activities. This flexibility allows for the creation of highly tailored reports that match your specific business requirements.
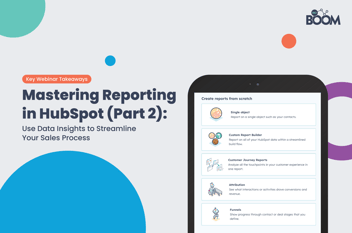
HubSpot offers a variety of report types that cater to different analytics and data visualisation needs. Here's a breakdown of the types of reports you can build in HubSpot:

1. Single Object Reports
These reports focus on a single type of data record, or "object," in HubSpot. Common examples of objects are contacts, companies, deals, or tickets. Single object reports allow you to analyse specific data points related to one category. For instance, you might create a single object report to look at all contacts created in a certain time frame, the source of your contacts, or a company's engagement level with your emails.
How do I build single object reports?
2. Custom Report Builder
The Custom Report Builder empowers you to create more complex reports by combining data from different objects and customising the report to fit your specific needs. This flexible reporting allows for a granular analysis of various data points across your HubSpot account. You could, for example, combine contact and deal data to see which marketing efforts are generating the most sales or to look at the performance of sales reps in terms of deals closed.
How do I build custom reports?
3. Customer Journey Reports
Customer Journey Reports are designed to give you insights into the full customer experience by tracking various touch-points along the customer's journey. These reports can help you understand which interactions are most influential in driving conversions and customer satisfaction. This holistic view encompasses all the interactions a customer has with your brand, from first website visit to post-sale support.
How do I build customer journey reports?
4. Attribution Reports
Attribution reports are essential for understanding which marketing activities contribute to conversions and revenue. These reports allocate credit to different marketing efforts across the customer's journey, helping you to determine the ROI of your marketing campaigns. With attribution reports, you can identify which channels, content, or campaigns are most effective at driving results.
How do I build attribution reports?
5. Funnels
Funnel reports allow you to visualise the progression of contacts or deals through different stages. They can help you understand where in the sales or marketing funnel you are losing prospects and where your processes are most effective. For example, a funnel report could show you how many contacts move from being a lead to a marketing-qualified lead to a sales-qualified lead, and finally to a customer.
How do I build funnel reports?
6. AI Assistant (Beta)
The AI Assistant report, currently in beta, suggests creating single object reports using HubSpot's artificial intelligence capabilities. This feature is aimed at simplifying the report creation process by allowing HubSpot's AI to analyse your data and generate meaningful reports. It's especially useful for those who may not be sure where to start with their data analysis or what might be most relevant to look at.
HubSpot Dashboards
Dashboards in HubSpot serve as centralised platform where multiple reports can be viewed together, offering a comprehensive snapshot of specific business functions or overall performance.
Dashboards are customisable, allowing users to choose which reports to include and how they should be arranged for optimal clarity. They can be created for individual use or shared among team members, fostering collaboration and ensuring everyone has access to the same information. Another key feature of HubSpot dashboards is their ability to provide real-time insights. This is crucial for making timely decisions based on the latest data, whether it's responding to sudden shifts in sales trends or adjusting marketing campaigns on the go.
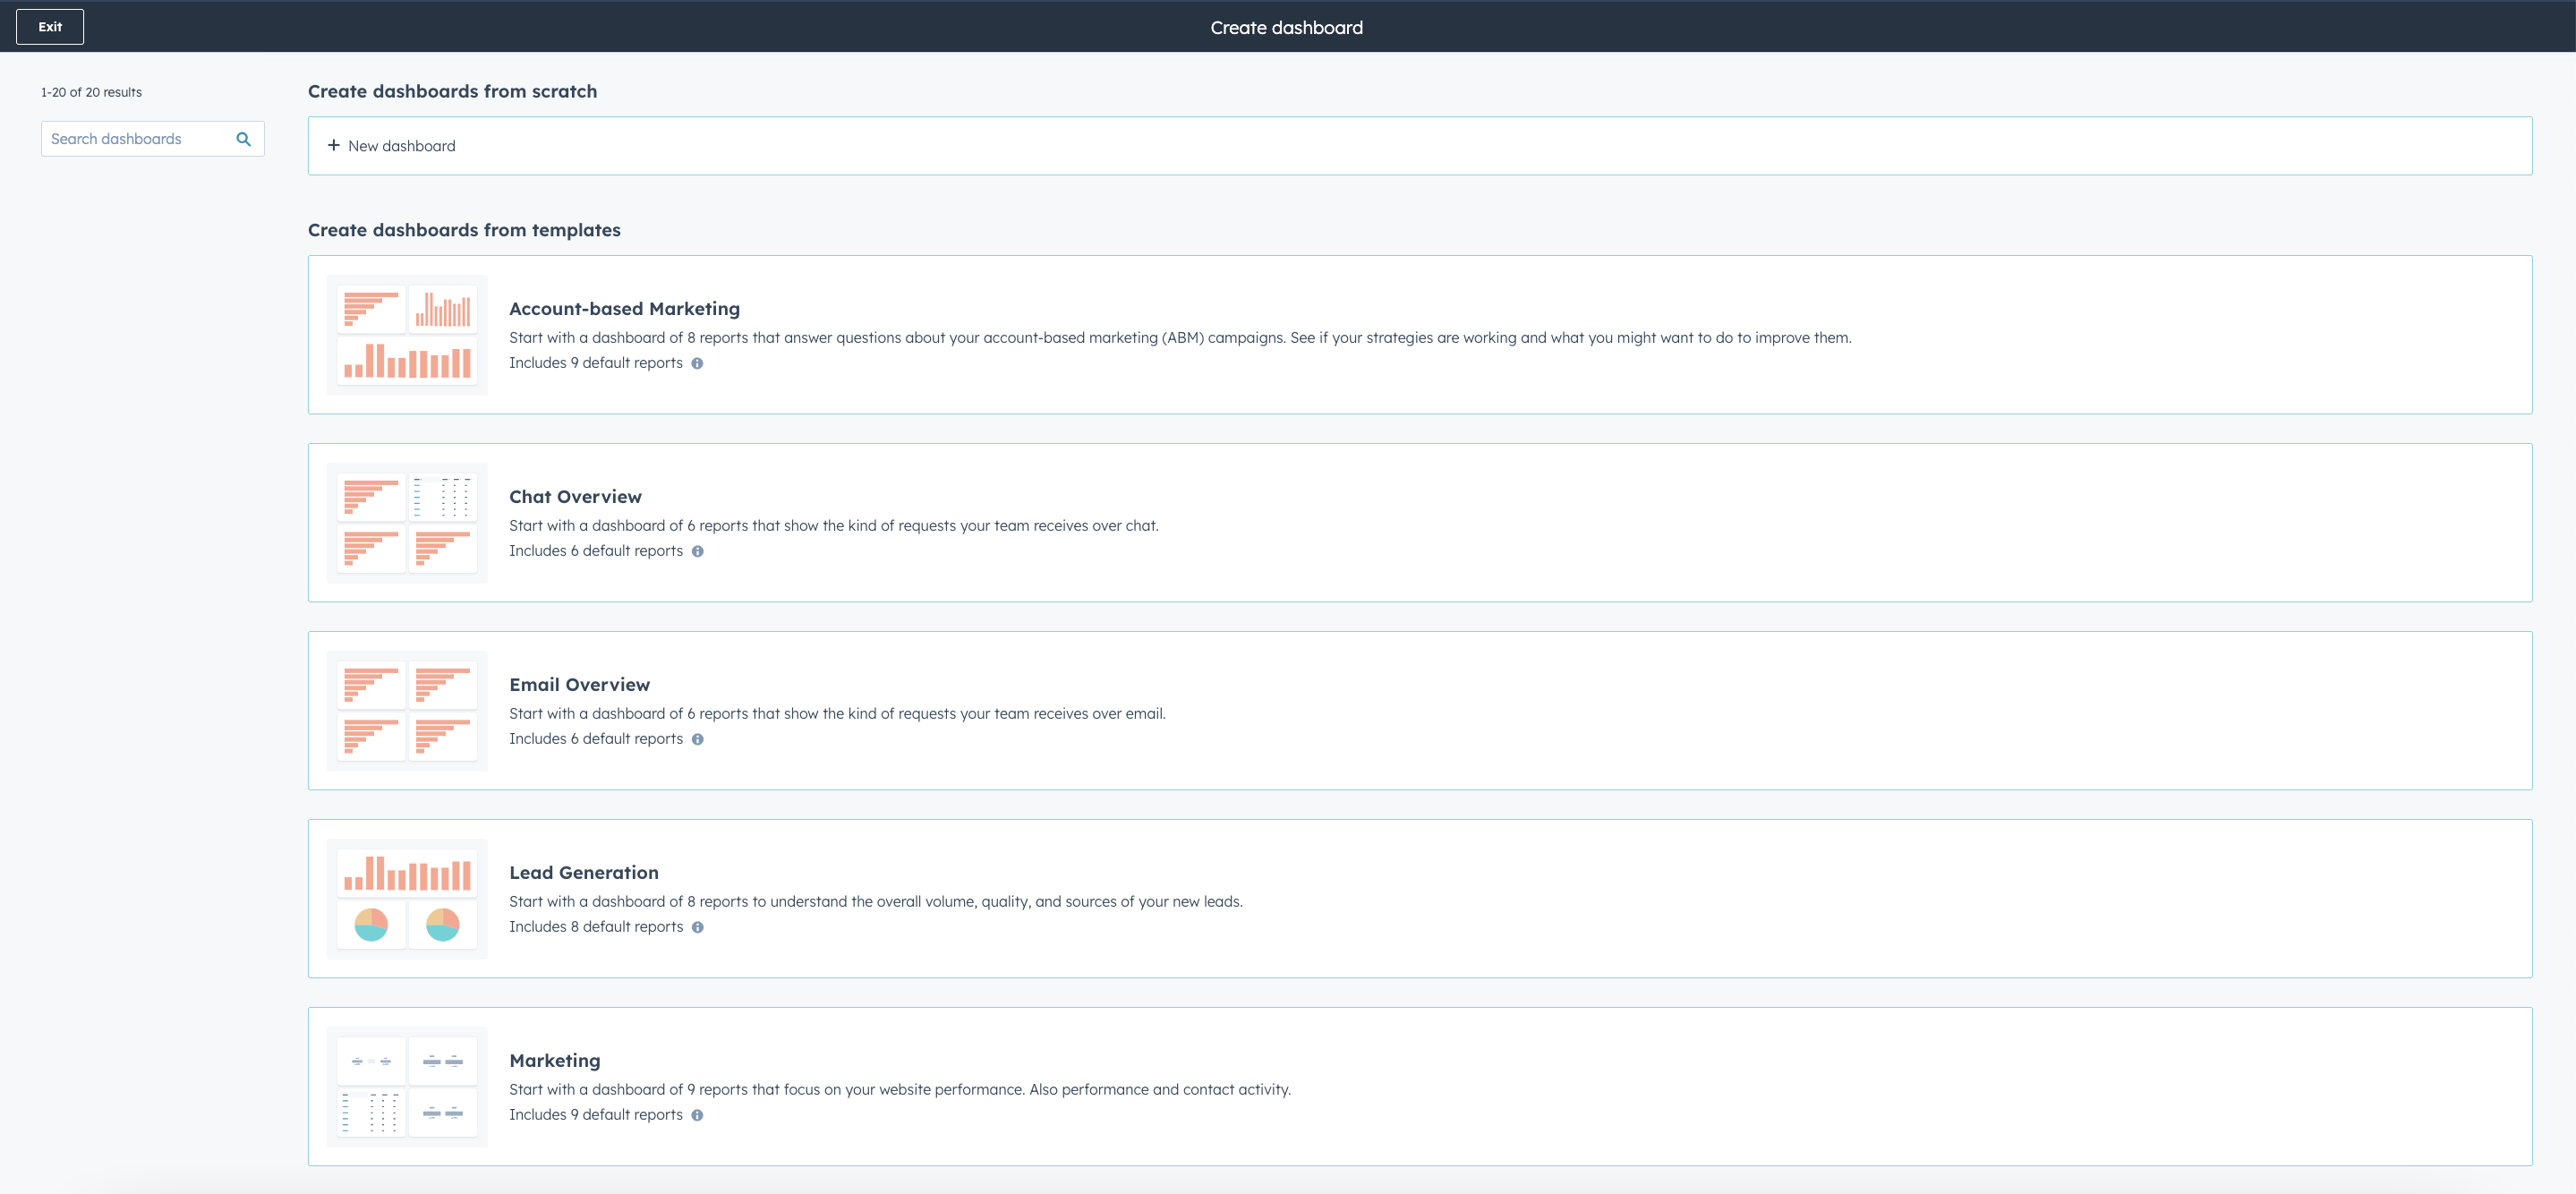
HubSpot offers several pre-built or ready-made dashboards that cater to different aspects of your business operations or you can build one yourself.
These pre-built dashboards come with a set of standard reports that are common to the needs of most businesses. However, HubSpot also allows you to customise these dashboards by adding or removing reports and modifying filters to better match your specific business requirements.
HubSpot Analytics Tools
HubSpot's analytics tools go beyond basic reporting and dashboards by offering specialised functionalities for in-depth analysis of specific areas, such as website traffic, ads, email marketing, SEO, marketing campaign or sales funnel performance. These tools come equipped with advanced features like cohort analysis, attribution reporting, and conversion path analysis, enabling users to understand not just what is happening but also why it's happening.
By leveraging these analytics tools, businesses can identify the most effective marketing channels, understand customer behaviours, and optimise their sales processes. This leads to more informed, data-driven strategies that align closely with the company's goals and customer needs.
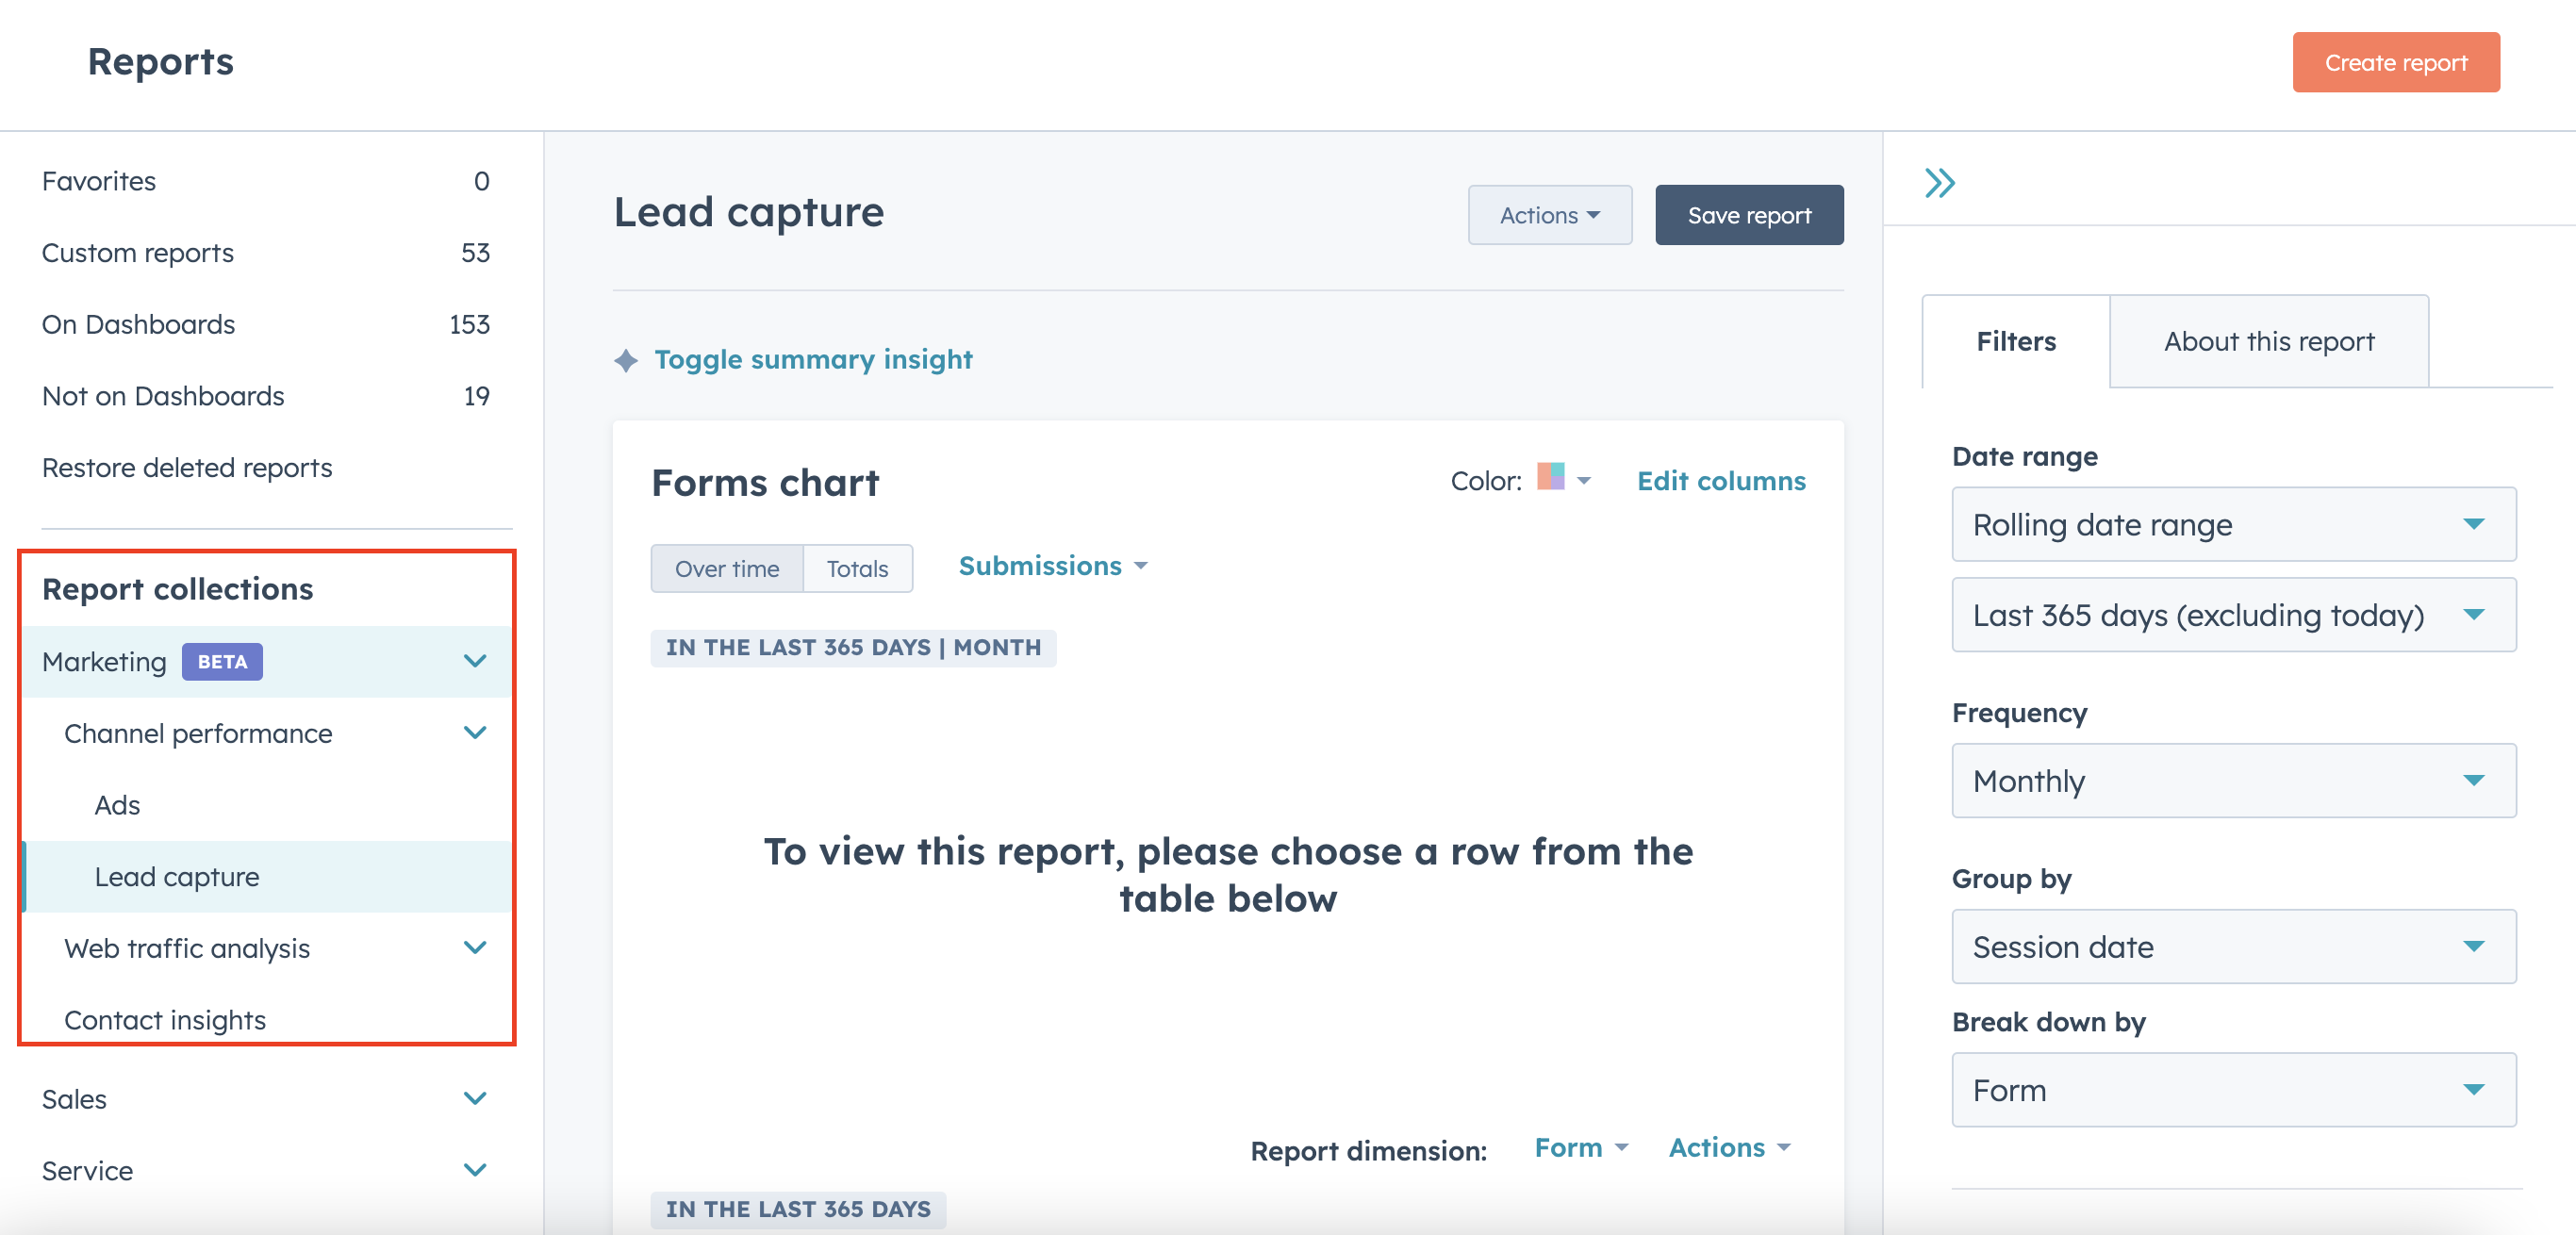
HubSpot also recently launched report collections for Marketing analytics. Here, they have centralised key marketing metrics and reports into one place. Marketing Collections consolidates all of your channels into distinct sections:
- Channel performance: Dive into Ad, Lead capture, and Marketing Email effectiveness.
- Contact insights: Gain insight into the origin and characteristics of contacts your team generated through marketing efforts.
- Revenue impact: Measures how different marketing activities are impacting revenue.
- Web traffic analysis: Evaluate web traffic metrics and gauge the success of your content.
10 Best Practices for Maintaining Effective HubSpot Reporting
Maintaining effective HubSpot reporting practices is crucial for businesses looking to leverage their marketing, sales, and service data to make informed decisions. HubSpot offers a robust analytics and reporting platform that can be customised to suit various business needs. Here are some best practices for maintaining effective HubSpot reporting:
1. Set Clear Objectives
Before diving into reporting, define what you aim to achieve. Identify key performance indicators (KPIs) that align with your business goals, whether it's improving lead generation, increasing sales efficiency, or enhancing customer service.
2. Customise Your Dashboards
HubSpot allows you to create custom dashboards tailored to different teams and objectives. Customise these dashboards to display relevant metrics and KPIs, ensuring that users have immediate access to the data most important to them.
3. Use a Consistent Naming Convention
Consistency in naming your campaigns, emails, landing pages, and other assets is crucial for clear and effective reporting. This makes it easier to track and analyse the performance of specific initiatives.
4. Segment Your Data
Utilise HubSpot’s segmentation tools to drill down into your data. Analyse your performance based on various criteria, such as demographics, buyer persona, lifecycle stage, or source. This can help identify trends and opportunities for optimisation.
5. Integrate with Other Tools
If you're using tools outside of HubSpot, consider integrating them to centralise your data. This can provide a more comprehensive view of your business performance and enhance the accuracy of your reports.
6. Regularly Review and Clean Your Data
Data accuracy is key to effective reporting. Regularly review your database for duplicates, inaccuracies, or outdated information and clean it up to ensure your reports are based on reliable data.
7. Leverage Automated Reporting
Automate your reporting processes where possible. Schedule regular report emails to stakeholders to ensure they are kept up-to-date with the latest data without having to manually check the dashboards.
8. Train Your Team
Make sure your team is well-trained on how to use HubSpot’s reporting features. Understanding how to interpret reports and take action based on the data is as important as the data itself.
9. Continuously Optimise
Use your reports to identify areas of improvement and adjust your strategies accordingly. Reporting is not just about measuring performance but also about using insights gained to optimise future efforts.
10. Stay Updated with HubSpot Features
HubSpot frequently updates its platform with new features and improvements. Stay informed about these updates and how they might enhance or affect your reporting capabilities.
For expert guidance on how to maximise the use of HubSpot reporting, explore our tips here: marketing or sales reports.
HubSpot Reporting Assistance
As you delve into the depths of HubSpot's reporting capabilities, it's clear that the platform holds untold potential for transforming your business's approach to data and analytics. However, to truly harness this power and tailor it to your unique needs, a guided touch can make all the difference. This is where our role as your potential partner becomes invaluable.
Contact us to unfold the full potential of your platform. Our team of experts is ready to provide you with personalised strategies and insights that align with your business objectives. Transform your HubSpot CRM journey today and see just how far your business can grow with the right expertise guiding your decisions.

.png)
